Swing Trading Dashboard Indicator with 2 FREE BONUSES!
Original website: https://indicatorvaulthq.com/swingdash/
Content: Swing Trading Dashboard Indicator, PDF.
Bonus #1 Market Force Indicator, PDF
Bonus #2 Swing Force Indicator, PDF
Struggling to find high-probability entries? This is for you:
New "Swing Trading Dashboard" Indicator Scans All Pairs and All Timeframes for the Highest-Probability Swing Trade Opportunities. And It's Capable of Finding Both Continuation & Reversal Trade Setups...
Using this dashboard is super easy, and it could help you find winning swing trades in 5 minutes or less. As close as it gets to a complete, AUTOMATED swing trading solution: The indicator shows you accurate entries and exactly where to place your stop loss and take profit.
Hi there,
Let's go back to the beginning:
6 months ago, I released the Swing Force indicator. And it quickly became our best-selling indicator.
For good reasons:
Swing Force is probably the best indicator when it comes to identifying high-probability trend reversal & continuation trade setups
For the first time, we've successfully combined support/resistance breakouts AND time-tested, proven price patterns to create this ULTIMATE trading machine.
It's extremely useful for locating market's turning points... for finding new market trends... and for detecting explosive breakouts. It works equally well for swing traders, and day traders, and scalpers...
Here's how it works:
The "Swing Force" indicator gives you a timely alert whenever a trend continuation or trend reversal trade set-up appears.
These high-probability trade setups are often followed by big market moves.
And they are very reliable because these setups are confirmed by TWO factors: strong breakout from support / resistance levels AND high-probability price action patterns.
So you can be confident entering a trade. No stress. No doubt. No uncertainty.
Let's see it in action:

In this case, when the market breaks out of a trading range, Swing Force indicator identifies a high-probability setup and gives you a reversal alert. This turns out to be the beginning of a strong uptrend.
Then, after a retracement, the indicator detects a continuation setup and generates a signal. And sure enough, the price moves up immediately afterward.
The secret behind Swing Force indicator's accuracy...
Here's exactly the secret behind Swing Force's accuracy: The indicator uses 2 stringent criteria to identify continuation or reversal trade setups: Strong breakout from support / resistance levels... AND... High-probability price action patterns.
That way, you can be confident that whenever you get a Swing Force alert, there's a great chance that a favorable market move is going to occur.
For example, let's see how it works on EUR/USD:

See how easy it is to profit from these Swing Force setups? Here's my own system that you could use as a starting point:
1. Buy when you get a buy alert. Sell when you get a sell alert.
2. Set your first profit target equal to the Average True Range value. Set your second profit target equal to 2X the Average True Range value.
Using these rules, let's see how we could easily profit from these Swing Force alerts on EUR/USD:

As you can see, for each of these alerts, almost immediately after we place our short trades, the market starts to move in our favor.
First and second profit targets are both triggered not long afterwards.
Nice & easy trades, don't you think?
Here's another trade on AUD/USD:

In this example, when the price breaks out of the previous support level, and Swing Force indicator detects a continuation setup, we place our short trade.
After that, the market keeps going down, and hits profit target 1 and profit target 2. We've got another winning trade.
Now, let me show you how...
Here's an advanced way to use Swing Force indicator, so that it's even MORE accurate...
Recently we discovered an advanced strategy to use the Swing Force indicator in order to boost its accuracy even more. With this strategy, we combine Swing Force with another of our custom indicators -- the Market Strength indicator (which we will also give you as a free bonus when you get the Swing Force indicator).
Here's how it works:

So, for this advanced method, we only buy when we get a Swing Force buy alert AND the Market Strength histogram is blue. And we only sell when we get a Swing Force sell alert AND the Market Strength histogram is red. And if the Market Strength histogram is yellow, the market is ranging, and we wouldn't want to take any long or short trade.

In the photo above, we also get a Swing Force buy alert. But at that time, the Market Strength histogram is red. So we don't take the trade.
So, now that you understand this advanced strategy, let's put it in action and see how...
Swing Force indicator works extremely well for breakout traders...
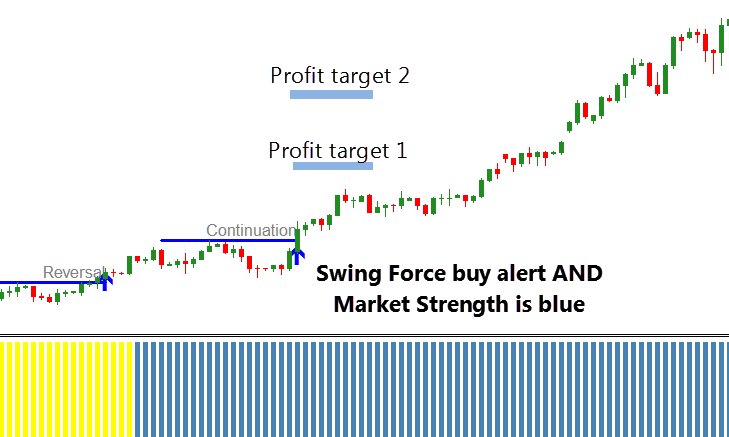
So in this case, the market has been stuck in a range for a while (Market Strength histogram is yellow). Then we get a Swing Force buy alert, telling us that a big breakout will likely happen. But at the time, the Market Strength histogram is still yellow, so we'll wait.s
A few bars later, there's another Swing Force buy alert. This time, Market Strength is blue. Our criteria are fulfilled, so we enter a long trade.
As expected, right after we buy, the price starts to move up aggressively. This turns out to be the beginning of a huge, gigantic uptrend.
Both of our profit targets are hit. And do you also notice that if you used a trailing stop in this trade, you would have even more profits? This shows that a Swing Force signal usually result in those big moves that you can easily take advantage of.
Breakout trades can't get easier than this, right?
But that's not all. Let me show you how...
Swing Force indicator helps trend traders get the most profits out of a trend...
Here's how:
The Swing Force indicator gets you in the trend when it begins. Then, as the trend progresses, the indicator gives you Continuation signals when there's high probability that the trend will likely continue.
For example, look at this chart:
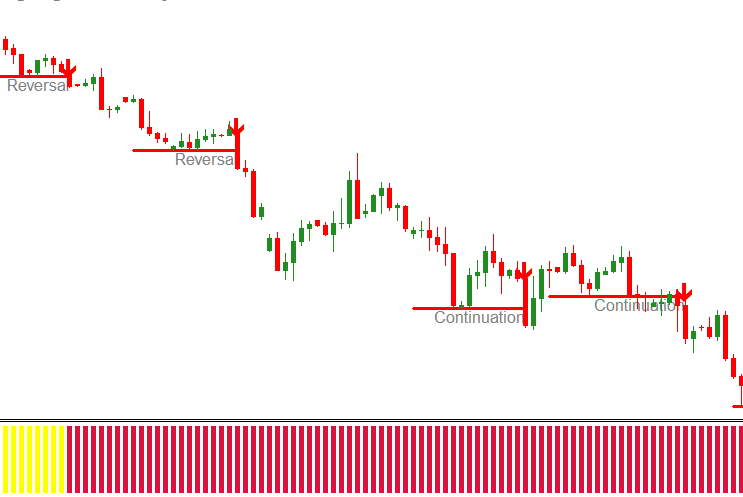
Here you can see, at the beginning of this downtrend, Swing Force gives you 2 reversal signals when the market switches from uptrend to ranging to downtrend.
Then, as the trend progresses, the indicator gives you additional continuation signals. This tells you that you should not exit your short trades yet. And depending your risk tolerance, you can also enter more short trades. This way, you can get the most out of this downtrend.
Cool, isn't it? But that's not all...
The Swing Force indicator is extremely useful for identifying market turning points...
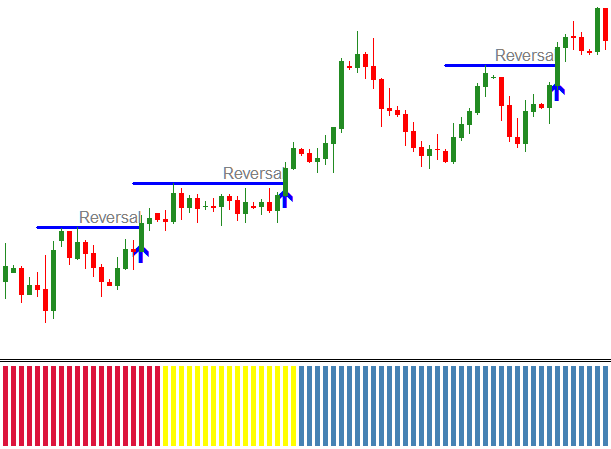
In this case, the market switches from downtrend to ranging to uptrend. Swing Force indicator identifies those turning points, and gives you 2 reversal alerts. Then, when it gives you the third buy alert, the market is now confirmed to be in an uptrend (Market Strength histogram has turned blue). So you place a long trade.
Let's see what happens next:
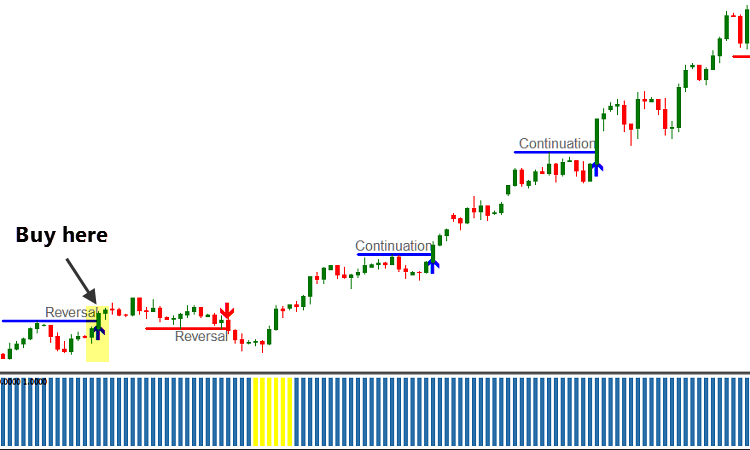
As it turns out, this is the very beginning of a huge uptrend. So you got a highly profitable (and easy) trade.
But that's not all...
Today, we're taking it to a whole new level:
So 6 months ago, we released the Swing Force indicator.
Out of the blue, it quickly became our best-selling product.
Among the emails we received from happy Swing Force customers, one stands out.
He said: "Swing Force works. No doubt about it. But I trade 10 currency pairs plus gold and S&P500.
Takes quite some time to go through each pair to see which trade setups have formed."
Gave me an idea.
What if we could add a Multi-Symbol Multi-Timeframe SCANNING feature to the Swing Force indicator?
What if we could develop some kind of "Swing Trading Dashboard" indicator that SCANS all the pairs you want to trade, on ALL time-frames for the highest-probability trade setups?
And shows you all the recently formed trade setups in all markets, on all timeframes on ONE beautiful, easy-to-use dashboard.
I'm happy to say: I'VE DONE IT.
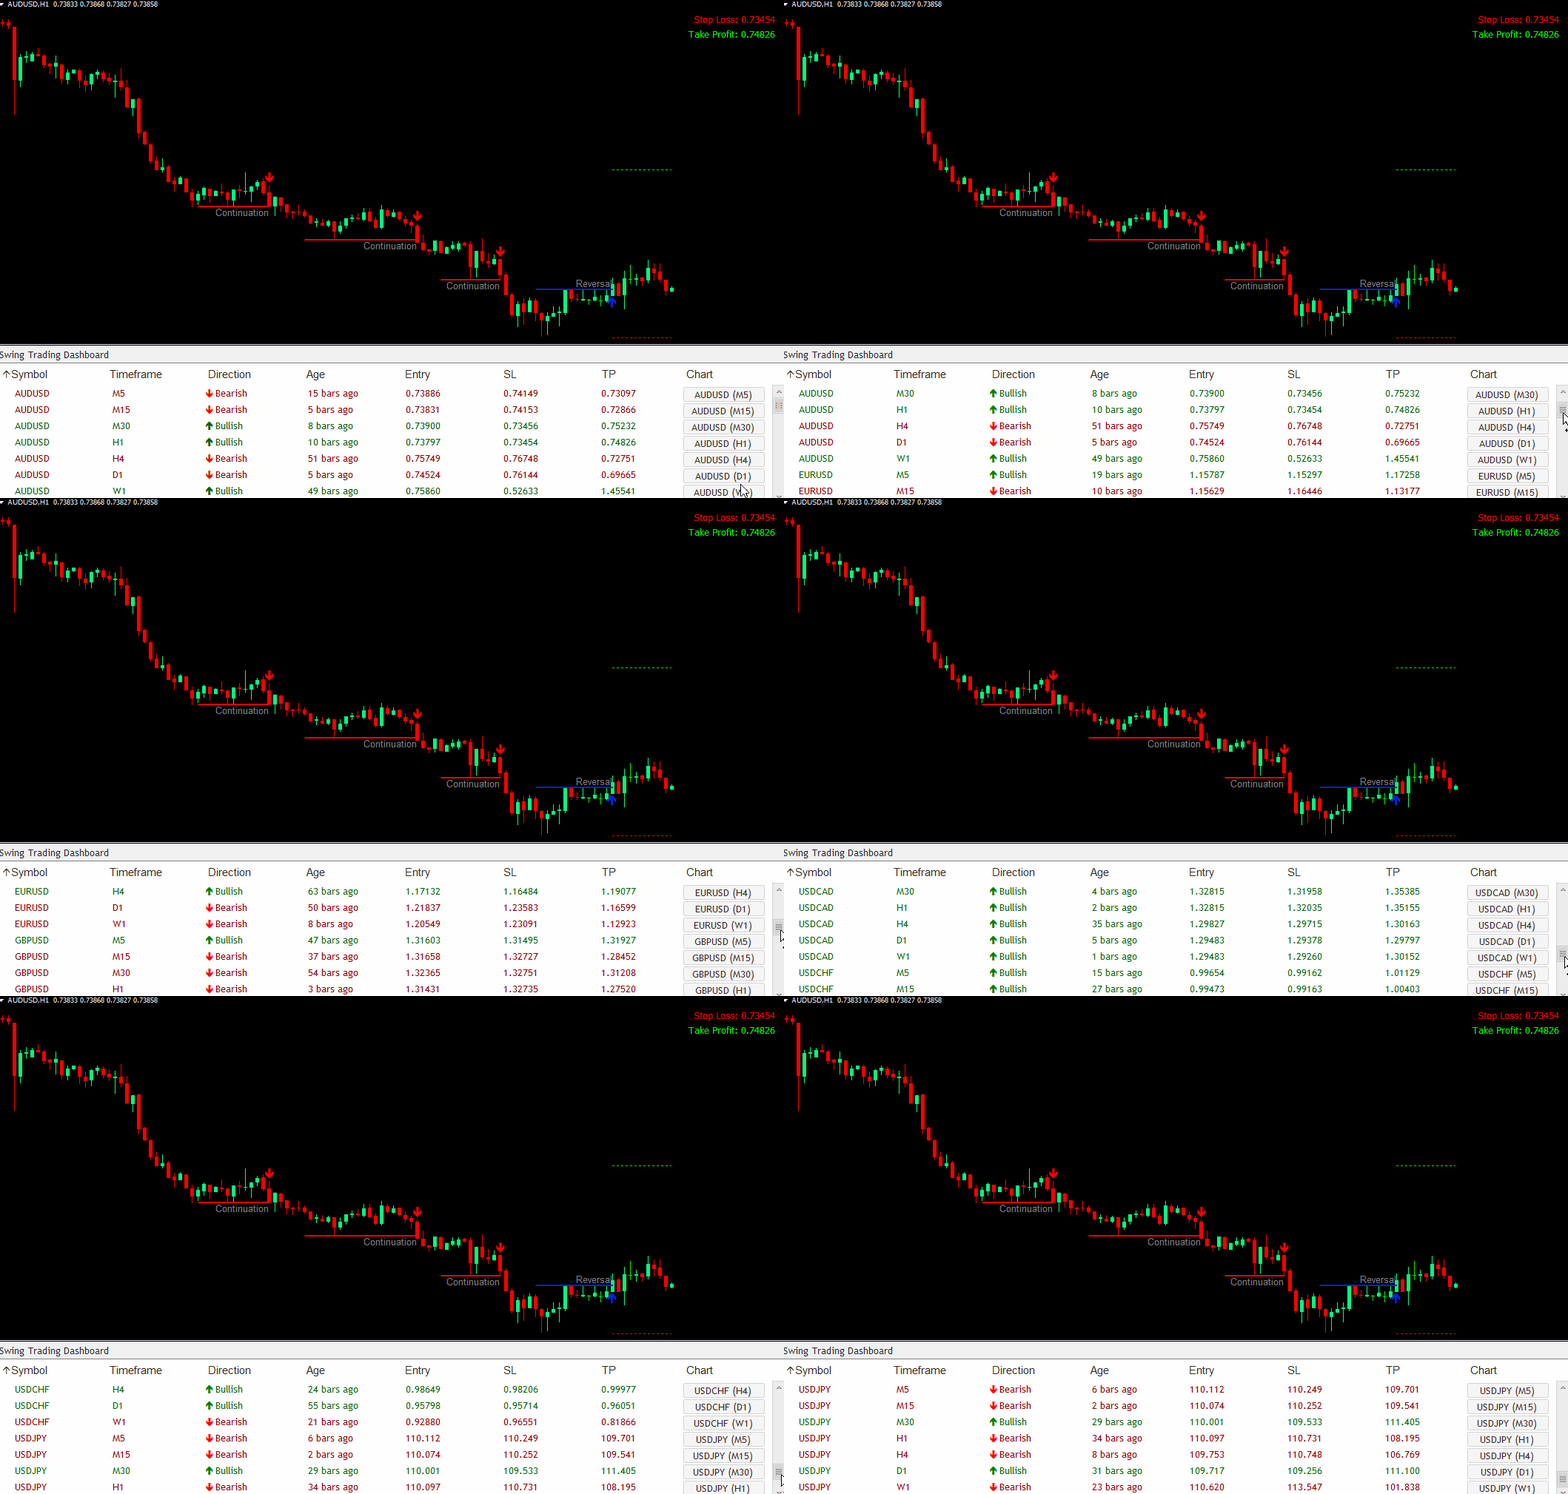
Here's a teaser: Look at the all-new Swing Trading Dashboard in action...
The Swing Trading Dashboard indicator displays all detected swing trade setups in ONE convenient, easy-to-use dashboard.
You no longer need to manually scan every pair and time-frame. The dashboard does all the hard work for you.
With just one look at the dashboard, you'll instantly know which high-probability trade setups has just formed on every pair and every time-frame (from 1-minute to monthly)...
So...
Let our Swing Trading Dashboard indicator do all the heavy lifting for you...
First, it will scan ALL currency pairs and ALL time-frames for the highest-probability continuation & reversal swing trade setups you could ever find. And all these calculations are done so fast - literally within seconds - you won't even notice the time.
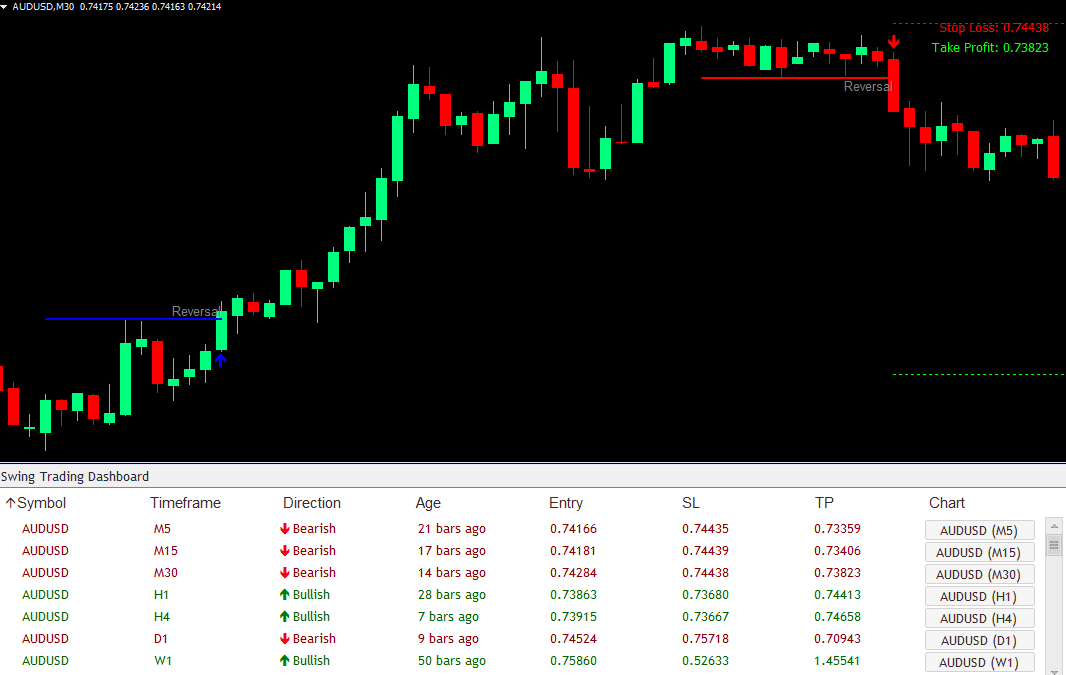
Second, the indicator will display a beautiful dashboard on your chart where you can see exactly what swing trade setup has recently formed on EVERY pair, EVERY time-frame.
Take a look below to see how cool it really is:
With just one look at the dashboard, you'll instantly know all the information you need to make a good trading decision. You'll instantly know which reversal & continuation trade setup appears on every time-frame (from 1-minute to monthly) and on every currency pair.
Not only that, you'll also know the exact direction of that pattern - whether it's bullish or bearish. And you'll know exactly how long ago that particular setup showed up.
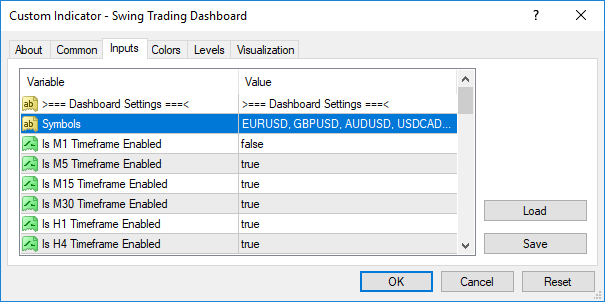
And you're in total control. You can specify which currency pairs and which time-frame you want the indicator to scan for these swing trade setups:
Remember, you can specify as many pairs as you like. You can also use it for indices, stocks, futures, and gold (anything your broker offers in Metatrader). Our Swing Trading Dashboard takes care of it all.
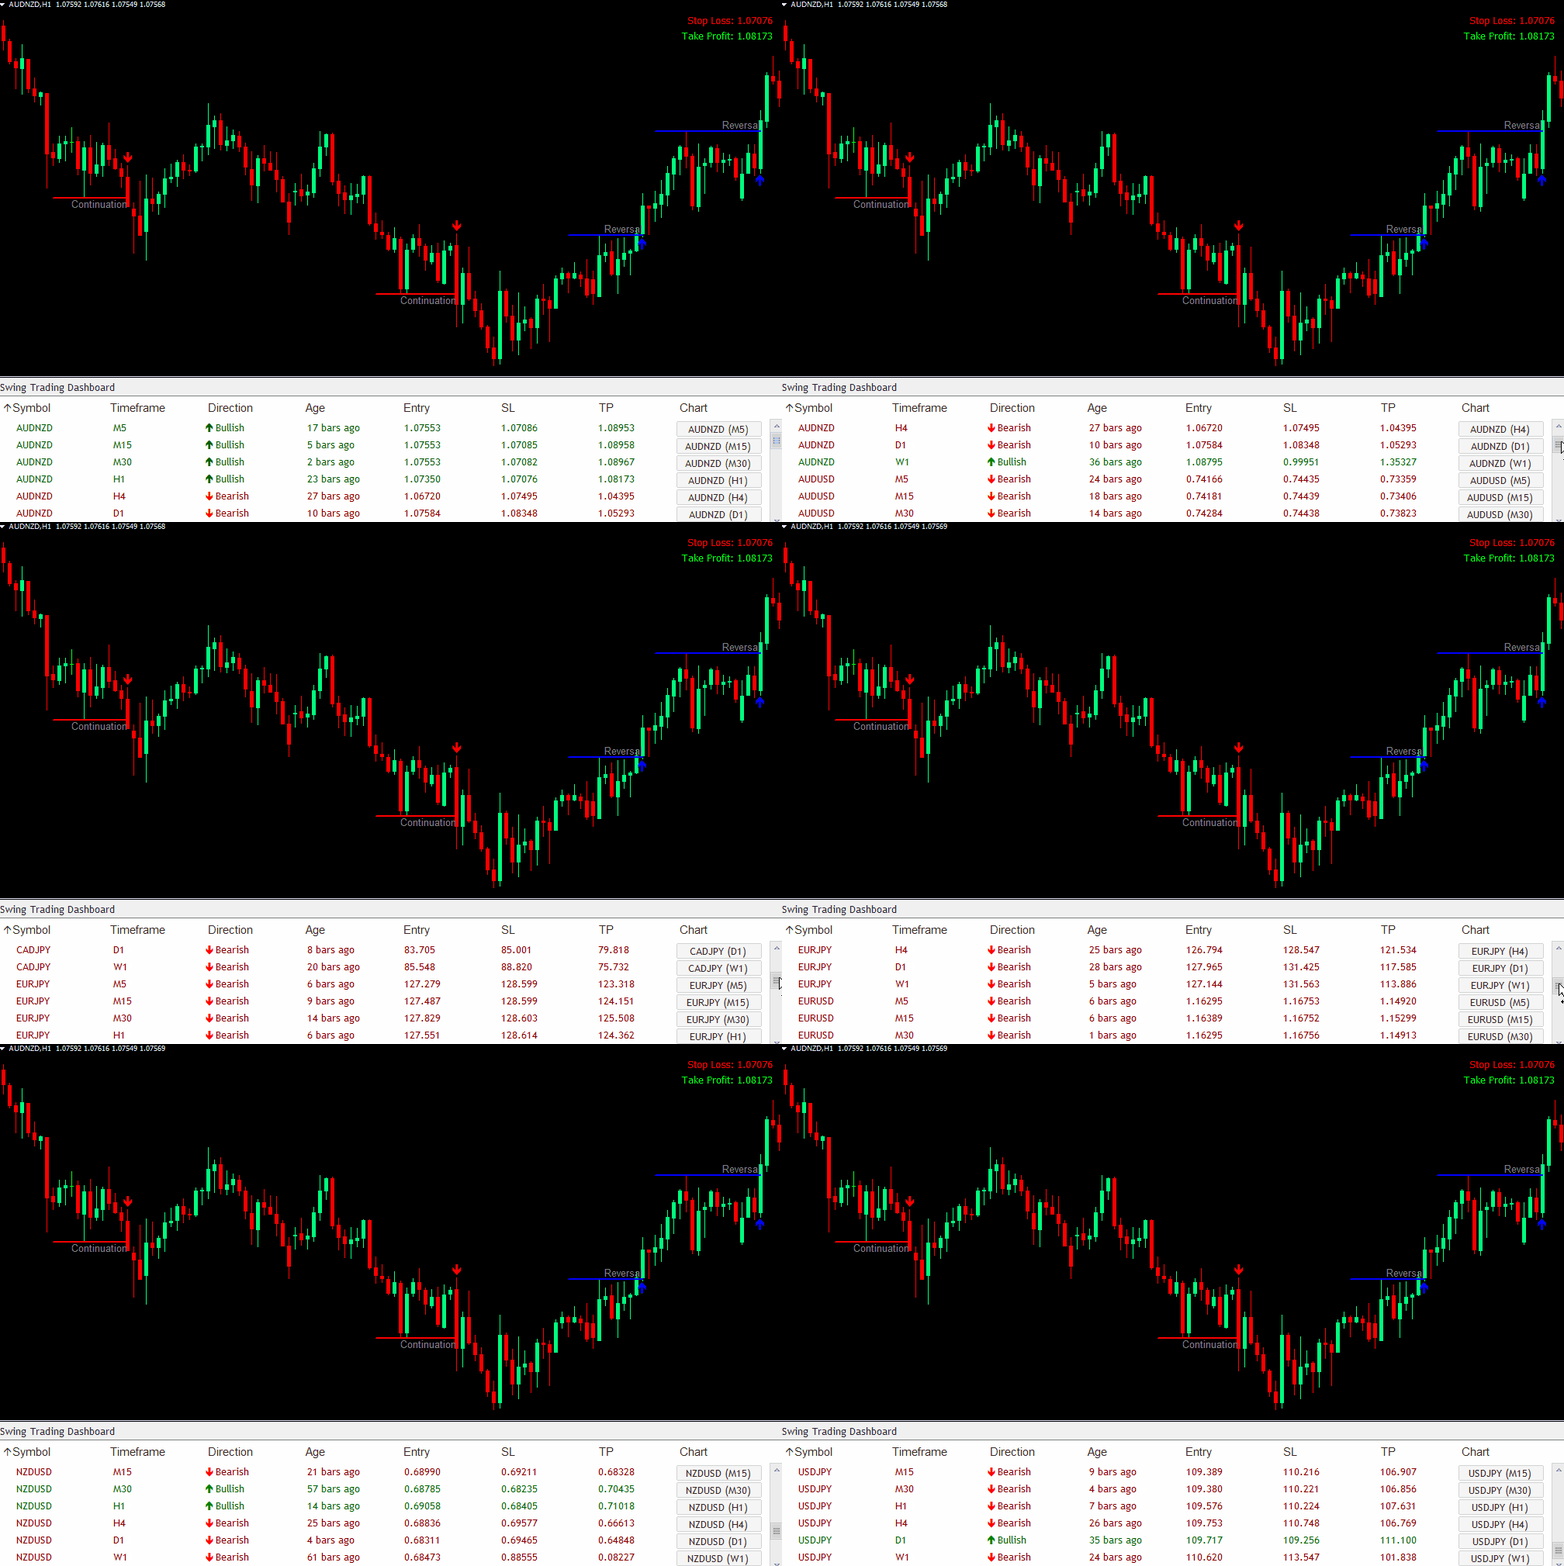
Let me show you a short clip where I scroll through 10 currency pairs (and all time-frames from 1-minute to monthly) and see all swing trade setups in my dashboard:
But maybe the most useful feature of the Swing Trading Dashboard indicator is...
Click on the symbol you want, and the indicator will open up that symbol's chart with the swing trade setup highlighted...
Take a look at this short clip to see what I mean:
That way, you can look at the dashboard first to see the overall picture across multiple time-frames. Then once you identify a pattern that you want to trade, just click on the symbol to open up the relevant chart, so you can analyze the pattern further.
And by the way, did you know that...
You can sort the dashboard in any way you like -- based on Symbol, Timeframe, Direction, or Age...
Let me show you exactly how it works:
Pretty cool, isn't it?
By the way, it's very, very easy to trade with the Swing Trading Dashboard indicator because...
The indicator gives you all kinds of alerts: Pop-up, Sound, Email, and Push Notifications as soon as a pattern appears...
So you'll never miss out on another important trade.
And my favorite part about Swing Trading Dashboard is that...
Since these trade setups are based on a UNIVERSAL trading concept, and it works on ANY timeframe and ANY currency pair (any financial instrument for that matter)...
The Swing Trading Dashboard indicator works equally well for day traders, swing traders, and long-term traders...
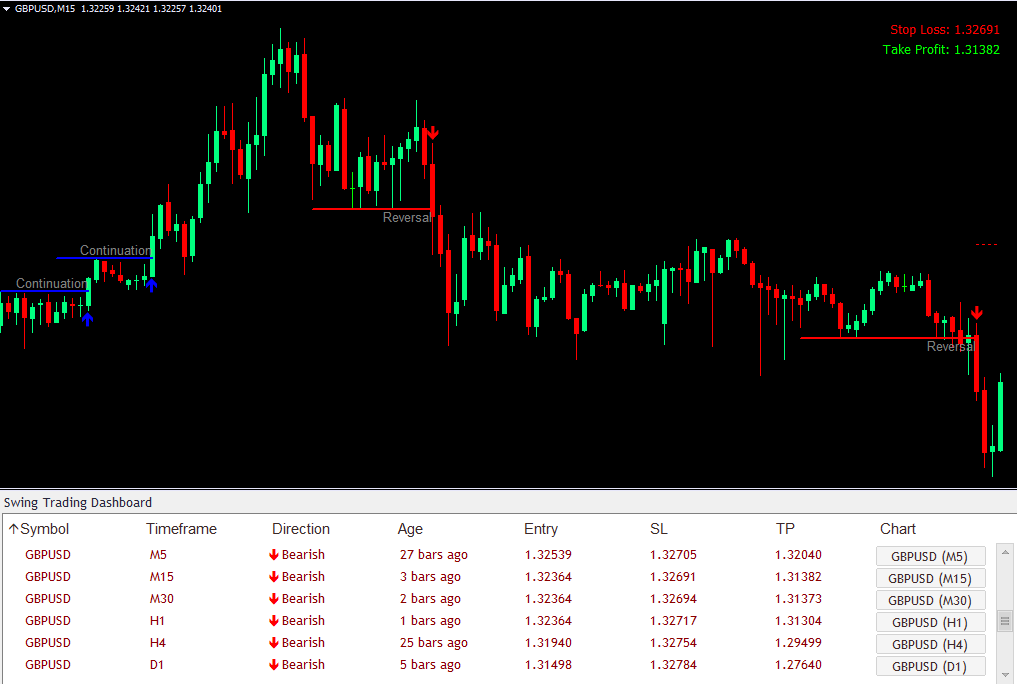
For example, if I were a day trader, I'd love this winning trade on the 15-minute timeframe:
Day Trading Example:
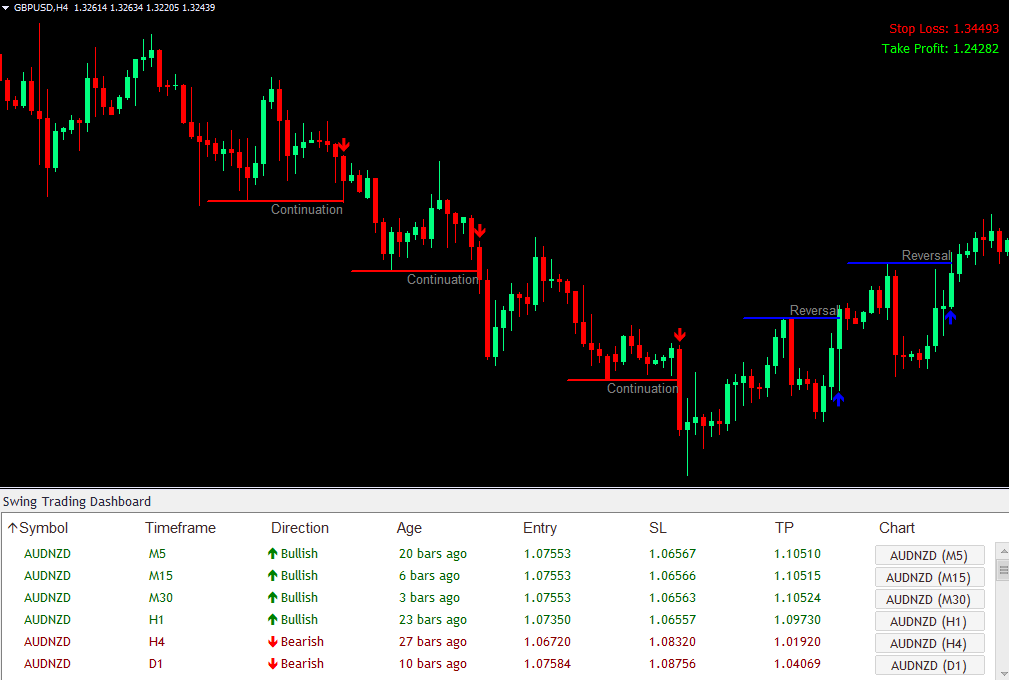
And if I were a swing trader, I'd love this winning trade on the 4-hour timeframe:
Swing Trading Example:
And if I were a long-term trader, I'd love this winning trade on the weekly timeframe:
Long-Term Trading Example:
This is as close as it gets to a COMPLETE, AUTOMATED swing trading solution:
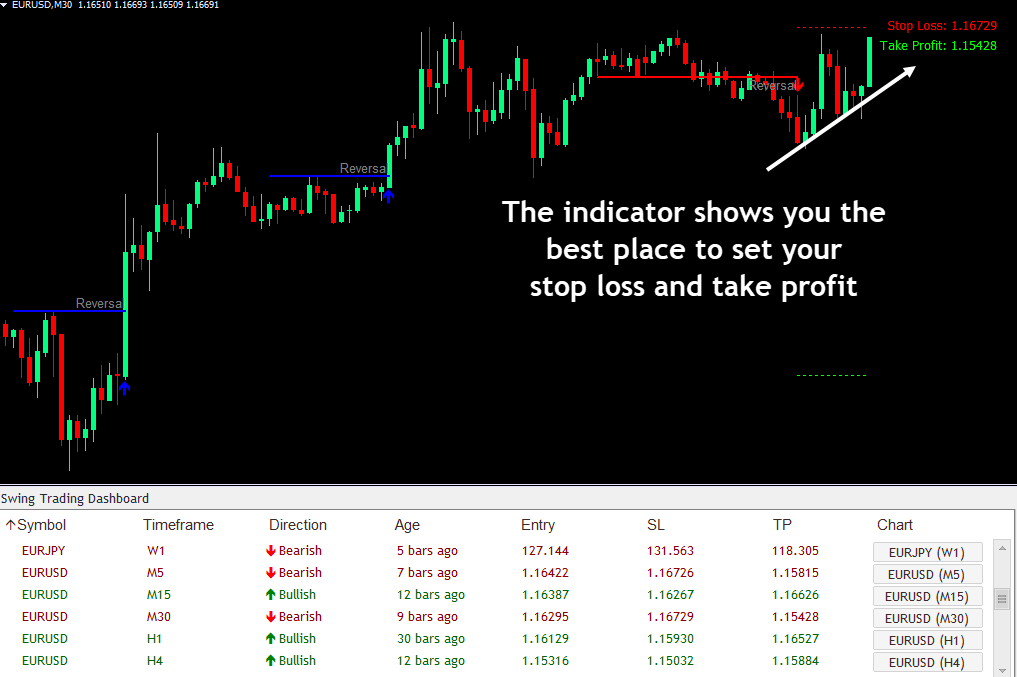
Once a trade entry is triggered, the indicator will show you the best place to place your stop loss and take profit.
In other words, Swing Trading Dashboard gives you EVERYTHING on a silver platter: High-probability trade entry, stop loss, take profit...
It does all of the hard work for you. You no longer have to guess when to enter or where to set your stop loss & take profit. Everything's taken care of. You don't have to lift a finger.
But Hang On... We're Not Done...
Further down this page, you'll notice there are TWO purchase options you can choose. You can get Swing Trading Dashboard indicator alone for an insanely generous price I'm giving the first 200.
Or... you can invest a little more and get the Dashboard Pro package.
So What's Inside The "Dashboard Pro" Package?
First off, you get the Swing Trading Dashboard indicator. And on top of that, you'll also get access to the ENTIRE collection of ALL of our flagship DASHBOARD indicators. Including Divergence Dashboard, Harmonic Dashboard, Day Trading Dashboard, Wolfe Wave Dashboard, Candlestick Dashboard, and many more.
To see the full list of all indicators included in the Dashboard Pro package, click here...
And here's where it gets even better:
If you grab Swing Trading Dashboard TODAY, you'll also get a BIG BONUS:
BIG BONUS: Swing Force Indicator
A perfect companion to Swing Trading Dashboard. The Swing Force indicator is perfect for you if you'd like to identify all the best swing trade setups on a single currency pair.
Fast, lightweight, and efficient. This indicator will automatically detect all of the highest probability swing trade setups for you.
Retail price: $99. But today you'll get it free when you invest in the Swing Trading Dashboard indicator.
DASHBOARD PRO - LIFETIME ACCESS
one-time payment
- Lifetime access to ALL dashboard indicators
- All features included. Works perfectly on Metatrader 4
- Unlimited license: Use the indicators on as many computers as you like.
DASHBOARD PRO - YEARLY ACCESS
per year
- Yearly access to ALL dashboard indicators
- All features included. Works perfectly on Metatrader 4
- Unlimited license: Use the indicators on as many computers as you like.
SINGLE INDICATOR
one-time payment
- Get Swing Trading Dashboard only.
- All features included. Works perfectly on Metatrader 4.
- Unlimited license: Use the indicator on as many computers as you like.
We use SSL secure connection on our website. The information you send is always encrypted and secure.


